Logging in and Accessing the Cloud Dashboard
- Log in to your MyVolico account. [MyVolico Login]
- If this is your first time accessing the portal, use the forgot password option to setup your account.
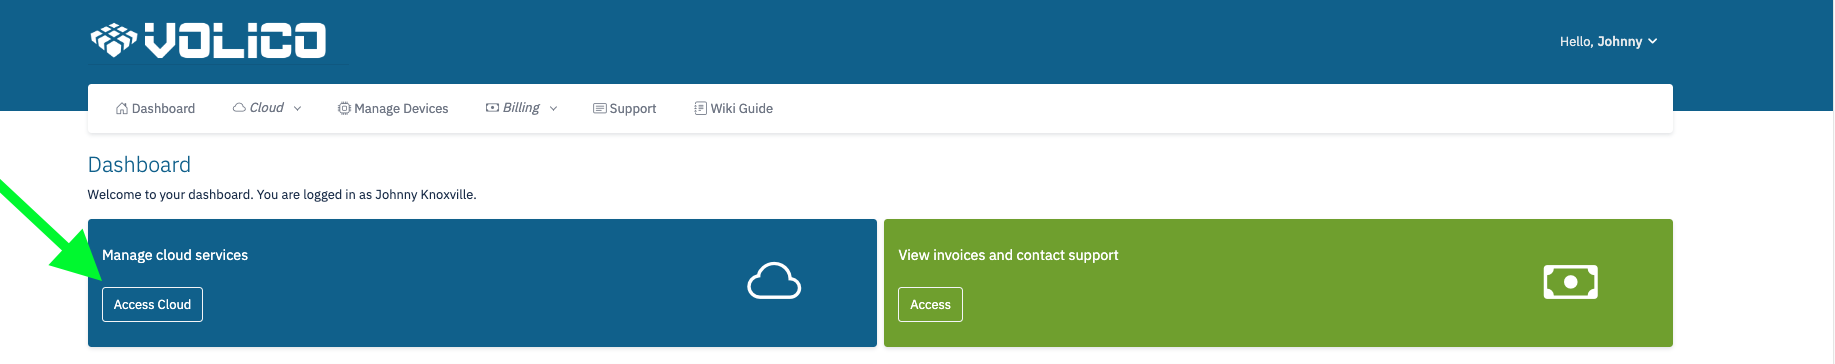
- Click on "Access Cloud" from the dashboard.
- You will be directed to the cloud portal.
Viewing Network Interface Bandwith
- To see the list of all network interfaces allocated to a VS:
- From the cloud dashboard, click on Virtual Servers menu.
- Click the label of the virtual server you're interested in.
- Click the Networking tab, then click Network Interfaces.
- Navigate to the Networking > Network Interfaces tab.
- Click the Statistics (chart) icon next to the network you want to analyze.
- The screen that appears displays two charts:
- The top chart shows bandwidth usage for the last 24 hours.
- The bottom chart shows usage for the last three months.
- Zoom into a specific time period by clicking and dragging in a chart. Use the Reset zoom button to return to the default view.
- Filter the statistics by date and time:
- Select the desired time period from the drop-down menu.
- Click the Apply button to update the statistics.
- These charts offer insights into the virtual server's network usage, helping you monitor and understand its performance over different time intervals. Use the provided tools to analyze trends and make informed decisions about network optimization
...